


第二,开放创新水平区域差距的相关研究。已有开放创新水平区域差距的研究大多采用简单的统计描述方法来测度区域差距,无法准确刻画区域差距大小与差距来源[6−7]。泰尔指数、变异系数、基尼系数分解方法为准确测度经济体的区域差距提供了定量研究方法[8−9]。但是,现有研究采用传统基尼系数与变异系数均是对研究样本的整体区域差距进行测度,无法准确实现对区域差距进行区域内、区域间差距分解,不能有效解释区域差距的来源;泰尔指数虽能将区域差距分解为区域内和区域间差距,但并未充分考虑子样本的分布状况,导致测算结果出现偏差[10−11]。因此,本文将采用Dagum基尼系数及其分解方法研究和分析8大地区国家高新区开放创新的区域差距问题。
1 研究方法与研究样本

2 国家高新区开放创新水平评价指标体系构建
2.1 国家高新区开放创新水平评价指标体系构建
表1 国家高新区开放创新水平的评价指标体系 |
| 目标层 | 一级指标 | 二级指标 |
| 国家高新区 开放创新水平 | 各类机构开放 创新度 | 园区当年外资企业数 |
| 外资研发机构数 | ||
| 企业设立的境外分支机构数(研发、生产和营销机构) | ||
| 企业委托境外单位(企业、高校以及科研院所)开展的科技活动经费支出 | ||
| 多元要素开放 创新度 | 海外留学归国人员和外籍常驻员工占从业人员的比例 | |
| 拥有的境外注册商标数 | ||
| 当年欧美日专利授权数 | ||
| 企业累计主导或参与制定的产业国际标准数 | ||
| 当年实际利用外资金额 | ||
| 当年引进境外技术和消化吸收费用支出 | ||
| 当年内资控股企业海外直接投资额 | ||
| 经济贸易开放 创新度 | 园区企业出口总额 | |
| 高新技术产品出口占出口总额的比例 | ||
| 技术服务出口额占出口总额的比例 |
2.2 国家高新区开放创新水平评价结果分析
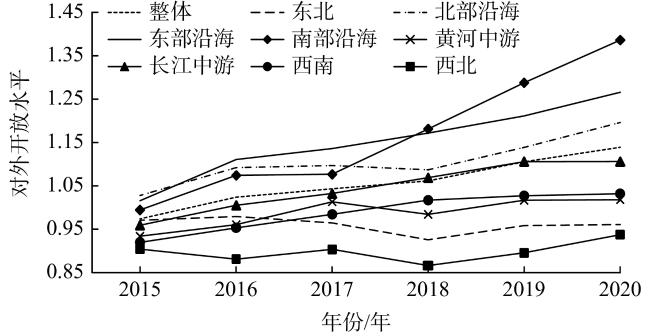
采用主成分分析方法测度国家高新区开放创新水平,测度结果如图2所示。一方面,就开放创新水平均值的大小而言,整体国家高新区开放创新水平的均值为1.05789,北部沿海、东部沿海、南部沿海国家高新区开放创新水平的均值都明显高于整体国家高新区开放创新的均值,其均值分别为1.10648、1.15195、1.16681;东北、黄河中游、长江中游、大西南及大西北国家高新区开放创新水平均值都低于整体国家高新区开放创新水平的均值。另一方面,就开放创新水平的演进趋势而言,由图2可知,整体、东部沿海、南部沿海、长江中游、大西南国家高新区开放创新水平呈现出持续增长态势,北部沿海、黄河中游、大西北国家高新区开放创新水平呈现出波动增长态势,东北国家高新区开放创新水平呈现出波动下降态势。
2.3 3类园区开放创新水平与增长率分析
按照科技部分类指导,将国家高新区划分为3类园区,即世界一流高科技园区(10家)、创新型科技园区(18家)和创新型特色园区(29家)。就开放创新水平均值而言,通过将3类园区与其他非3类园区比较可知,在开放创新水平排名前50的国家高新区中有39家3类园区,占比为78%,仅有11家其他非3类园区,占比为22%。由此可见,3类园区开放创新水平大体好于其他非3类园区。在排名前50的国家高新区中,10家世界一流高科技园区占据前10名位置,有16家创新型科技园区与13家创新型特色园区,占创新型科技园区总数与创新型特色园区总数的比例分别为88.9%、44.8%,这也直接验证本文指标体系和研究结论具有高度可信性。
3 Dagum基尼系数及其分解结果
3.1 8大地区国家高新区开放创新水平的整体区域差距
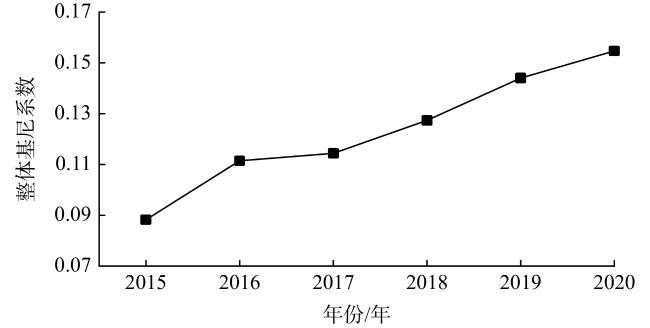
Dagum基尼系数及其分解结果如图3所示。8大地区国家高新区开放创新水平的整体基尼系数均值为0.12366,呈现出了持续上升态势,年均增长12.1%,表明8大地区国家高新区开放创新的整体区域差距逐年扩大。
3.2 国家高新区开放创新水平的区域内差距
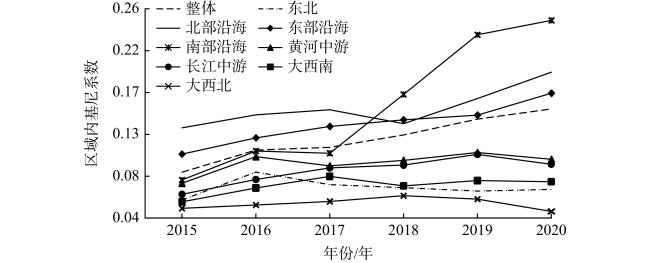
图4展示了8大地区国家高新区开放创新水平的区域内基尼系数。一方面,就区域内差距的大小而言,南部沿海、北部沿海及东部沿海国家高新区开放创新水平的区域内差距最大,其区域内基尼系数均值分别为0.15821、0.15591、0.13844;黄河中游和长江中游国家高新区开放创新水平的区域内差距次之;大西南、东北、大西北国家高新区开放创新水平的区域内差距最小。另一方面,由图4可知,除大西北国家高新区外,其他地区的国家高新区开放创新水平的区域内差距均呈现扩大态势,但具体演进过程各异。南部沿海国家高新区开放创新水平的区域内差距增长最大,年均增长率为27.3%,增速远远高于整体国家高新区区域内差距的增速。东部沿海、长江中游、北部沿海国家高新区开放创新水平的区域内差距增长次之,年均增长率依次为9.9%、8.9%、8%。大西南、黄河中游、东北国家高新区开放创新水平的区域内差距增长相对较低。值得强调的是,大西北国家高新区开放创新水平的区域内差距出现负增长,年均增长率为−0.6%,是8大地区中国家高新区的区域内差距唯一出现收敛的园区。
3.3 国家高新区开放创新水平的区域间差距
表2展示了8大地区国家高新区开放创新水平的区域间差距。就国家高新区开放创新水平的区域间差距大小而言,北部沿海与南部沿海、北部沿海与东部沿海、东部沿海与南部沿海国家高新区开放创新水平的区域间差距最大,其区域间基尼系数均值分别为0.16421、0.15321、0.15282;东北与大西南、大西北与大西南、东北与大西北国家高新区开放创新水平的区域间差距最小;其他地区国家高新区开放创新水平的区域间差距均值均介于0.08632~0.14392之间。
表2 区域间差距 |
| 区域 | 年份/年 | 均值 | |||||
| 2015 | 2016 | 2017 | 2018 | 2019 | 2020 | ||
| 东北与北部沿海 | 0.10528 | 0.12651 | 0.12462 | 0.12033 | 0.13022 | 0.14953 | 0.12608 |
| 东北与东部沿海 | 0.09037 | 0.11556 | 0.12120 | 0.14256 | 0.13972 | 0.15893 | 0.12806 |
| 东北与南部沿海 | 0.07392 | 0.10649 | 0.10347 | 0.15313 | 0.18576 | 0.20869 | 0.13857 |
| 东北与黄河中游 | 0.07331 | 0.09872 | 0.08755 | 0.09043 | 0.09289 | 0.09058 | 0.08891 |
| 东北与长江中游 | 0.06424 | 0.08689 | 0.08814 | 0.10449 | 0.10325 | 0.10058 | 0.09127 |
| 东北与大西南 | 0.06535 | 0.08283 | 0.08271 | 0.08786 | 0.08066 | 0.08031 | 0.07995 |
| 东北与大西北 | 0.06459 | 0.08317 | 0.07350 | 0.07513 | 0.06954 | 0.06221 | 0.07135 |
| 北部沿海与东部沿海 | 0.12526 | 0.14059 | 0.15037 | 0.14745 | 0.16418 | 0.19140 | 0.15321 |
| 北部沿海与南部沿海 | 0.11145 | 0.13365 | 0.13594 | 0.16082 | 0.20921 | 0.23420 | 0.16421 |
| 北部沿海与黄河中游 | 0.11299 | 0.13726 | 0.13008 | 0.12577 | 0.14293 | 0.15778 | 0.13447 |
| 北部沿海与长江中游 | 0.10679 | 0.12327 | 0.12956 | 0.12152 | 0.14088 | 0.15170 | 0.12895 |
| 北部沿海与大西南 | 0.10794 | 0.12603 | 0.13179 | 0.11399 | 0.12961 | 0.14598 | 0.12589 |
| 北部沿海与大西北 | 0.10733 | 0.13336 | 0.12917 | 0.13270 | 0.13949 | 0.14426 | 0.13105 |
| 东部沿海与南部沿海 | 0.09648 | 0.12047 | 0.12551 | 0.15975 | 0.19845 | 0.21626 | 0.15282 |
| 东部沿海与黄河中游 | 0.09728 | 0.12834 | 0.12381 | 0.14039 | 0.14517 | 0.15977 | 0.13246 |
| 东部沿海与长江中游 | 0.09014 | 0.10857 | 0.12083 | 0.12666 | 0.13309 | 0.14323 | 0.12042 |
| 东部沿海与大西南 | 0.08983 | 0.11286 | 0.12541 | 0.12356 | 0.13197 | 0.14814 | 0.12196 |
| 东部沿海与大西北 | 0.08994 | 0.12598 | 0.12899 | 0.15930 | 0.15727 | 0.15824 | 0.13662 |
| 南部沿海与黄河中游 | 0.08308 | 0.11891 | 0.10809 | 0.15293 | 0.19272 | 0.20777 | 0.14392 |
| 南部沿海与长江中游 | 0.07513 | 0.10175 | 0.10568 | 0.14192 | 0.18395 | 0.19414 | 0.13376 |
| 南部沿海与大西南 | 0.07639 | 0.10518 | 0.10979 | 0.13978 | 0.18306 | 0.19726 | 0.13524 |
| 南部沿海与大西北 | 0.07639 | 0.11603 | 0.11039 | 0.16879 | 0.19952 | 0.20749 | 0.14643 |
| 黄河中游与长江中游 | 0.07292 | 0.09742 | 0.09507 | 0.10678 | 0.11498 | 0.10842 | 0.09927 |
| 黄河中游与大西南 | 0.06835 | 0.09102 | 0.09474 | 0.09323 | 0.09657 | 0.09247 | 0.08940 |
| 黄河中游与大西北 | 0.06658 | 0.08775 | 0.08997 | 0.09583 | 0.09654 | 0.08123 | 0.08632 |
| 长江中游与大西南 | 0.06400 | 0.07932 | 0.09285 | 0.09154 | 0.10139 | 0.09486 | 0.08733 |
| 长江中游与大西北 | 0.06403 | 0.08516 | 0.09008 | 0.11815 | 0.11693 | 0.09591 | 0.09505 |
| 大西北与大西南 | 0.05571 | 0.07111 | 0.07733 | 0.09661 | 0.08628 | 0.06941 | 0.07607 |
就年均增长率而言,南部沿海国家高新区与东北、大西北、黄河中游、长江中游、大西南、东部沿海、北部沿海国家高新区开放创新水平能力的区域间差距增速较快,年均增长率分别为24.6%、24.4%、21.9%、21.7%、21.6%、17.9%、16.4%。同理可知,东部沿海国家高新区与大西北、东北、黄河中游、大西南国家高新区开放创新水平区域间差距的增速次之,年均增长率分别为13.1%、12.4%、11.1%、10.9%。大西北与大西南国家高新区、东北与黄河中游国家高新区、黄河中游与大西北国家高新区、东北与大西南国家高新区、东北与大西北国家高新区开放创新水平能力的区域间差距增速相对较慢,年均增长率分别为6.2%、5.4%、5.1%、4.8%、0.3%。其他地区国家高新区的区域间差距年均增长率基本维持在6.2%~10.2%之间。总之,8大地区国家高新区开放创新水平的区域间差距均呈现出了扩大态势。
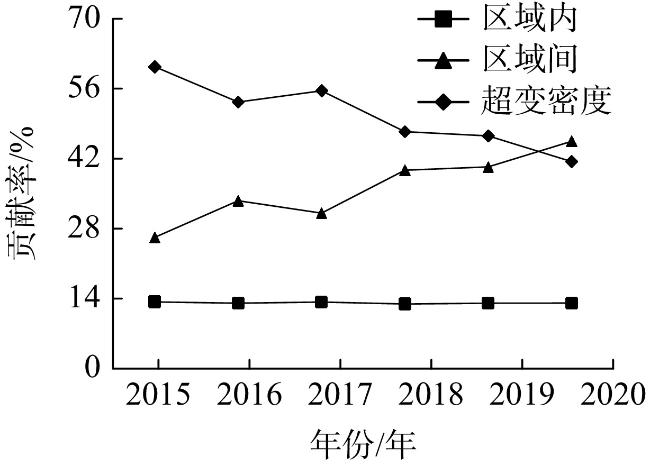
3.4 国家高新区开放创新水平区域差距来源的识别
4 国家高新区开放创新水平空间转移特征
4.1 传统Markov链估计结果分析
采用传统Markov链和空间Markov链方法来估计2015—2020年8大地区国家高新区开放创新水平的转移概率矩阵。由传统Markov链估计结果(表3)可知,第一,不同水平国家高新区开放创新能力的转移特征具有较大的差异。2015—2020年,处于低水平、中低水平、中高水平的国家高新区开放创新能力向上发生转移的概率明显大于其保持平稳状态的概率。处于低水平的国家高新区开放创新能力向中低水平、中高水平、高水平发生跃迁的概率相等,表明处于低水平开放创新能力的国家高新区会以相同概率向不同级别水平跃升;处于中低水平开放创新的国家高新区分别向中高水平转移的概率明显小于向高水平转移的概率,表明处于中低水平国家高新区的开放创新水平会产生跨级跳跃现象。同时,处于高水平的国家高新区开放创新水平能力保持稳定状态的概率大于其向下发生转移的概率,表明高水平的国家高新区能够凭借其优越的开放创新基础和条件,持续强化开放创新能力,进而能够保持其开放创新水平的优势地位。第二,国家高新区开放创新水平存在明显的“俱乐部趋同”现象。2015—2020年,处于高水平的国家高新区开放创新能力保持稳定的概率为0.88889,向下发生转移的概率很小,说明高水平国家高新区的开放创新能力呈现出了“俱乐部趋同”现象。第三,国家高新区开放创新能力向上、向下转移概率呈现非对称分布现象。国家高新区开放创新能力转移概率主要分布于对角线的右上方,即低水平、中低水平、中高水平国家高新区开放创新水平能力向上转移的概率明显大于向下转移概率,表明国家高新区开放创新水平大体上都呈现出了向更高水平迈进的态势,这个结论与前文论述的不同地区国家高新区开放创新能力均呈现出上升态势的结论一致。具体而言,处于不同水平的国家高新区开放创新能力向上转移的最低概率为0.43243,向下转移的最高概率为0.18919。
表3 全期和分时期的国家高新区开放创新水平的传统Markov链转移概率矩阵 |
| a−1/a | 低 | 中低 | 中高 | 高 |
| 低 | 0.18919 | 0.27027 | 0.27027 | 0.27027 |
| 中低 | 0.02703 | 0.32432 | 0.24324 | 0.40541 |
| 中高 | 0.02703 | 0.16216 | 0.37838 | 0.43243 |
| 高 | 0.08333 | 0.02778 | 0 | 0.88889 |
4.2 空间Markov链估计结果
表4展示了全样本周期8大地区国家高新区开放创新水平的空间Markov链转移概率矩阵。空间Markov链卡方检验结果表明,Q统计值均在10%的水平下显著,这说明在不同的时间间隔条件下空间关联因素对国家高新区开放创新水平的状态转移产生了显著的影响。
表4 全样本周期国家高新区开放创新能力的空间Markov链转移概率矩阵 |
| 空间滞后 | a/a−1 | 低 | 中低 | 中高 | 高 |
| 低 | 低 | 0.09091 | 0.36364 | 0.27273 | 0.27273 |
| 中低 | 0 | 0.40000 | 0.30000 | 0.30000 | |
| 中高 | 0 | 0.11111 | 0.44444 | 0.44444 | |
| 高 | 0.14286 | 0.14286 | 0 | 0.71429 | |
| 中低 | 低 | 0.33333 | 0.22222 | 0.33333 | 0.11111 |
| 中低 | 0 | 0.16667 | 0.16667 | 0.66667 | |
| 中高 | 0.08333 | 0.16667 | 0.58333 | 0.16667 | |
| 高 | 0.10000 | 0 | 0 | 0.90000 | |
| 中高 | 低 | 0.28571 | 0.28571 | 0.14286 | 0.28571 |
| 中低 | 0.10000 | 0.50000 | 0.30000 | 0.10000 | |
| 中高 | 0 | 0.18182 | 0.18182 | 0.63636 | |
| 高 | 0.11111 | 0 | 0 | 0.88889 | |
| 高 | 低 | 0.10000 | 0.20000 | 0.30000 | 0.40000 |
| 中低 | 0 | 0.18182 | 0.18182 | 0.63636 | |
| 中高 | 0 | 0.20000 | 0.20000 | 0.60000 | |
| 高 | 0 | 0 | 0 | 1.00000 |
第一,不同水平的邻域开放创新环境对国家高新区开放创新水平的提升作用具有异质性。水平较高的邻域开放创新环境对周边国家高新区开放创新水平的提升具有积极促进作用,如P13/4>P13/1、P34/4>P34/1,表明高水平开放创新水平的国家高新区对周边国家高新区开放创新水平能力的提升具有引领带动作用,这主要是由于相互竞争与知识溢出效应推动了邻近国家高新区开放创新水平能力的协同增长。相反,水平较低的邻域开放创新水平环境对邻近国家高新区开放创新水平能力具有明显负向作用,表明水平较低的邻域开放创新水平环境对周边国家高新区开放创新水平会产生抑制作用,如P41/1>0、P42/1>0。
第二,不同水平的邻域开放创新环境对国家高新区开放创新水平的向上、向下转移概率的影响作用不对称。无论是在何种水平邻域开放创新环境下,其转移概率大体分布在对角线的右上方,表明国家高新区开放创新水平向上转移的概率明显大于向下转移的概率,呈现出向上、向下转移的非对称态势。
第三,相邻国家高新区开放创新能力的差距对国家高新区开放创新水平的影响不同步,即两者不成比例。在高水平邻域开放创新环境下,处于中高水平国家高新区开放创新水平向上转移的概率为0.6;而在低水平邻域开放创新环境下,处于中高水平国家高新区开放创新水平向上转移的概率则变为0.3,前者概率是后者的2倍。原因可能是,当相邻国家高新区开放创新能力差距较小时,由于没有一方处于明显创新劣势地位,双方往往会通过相对平等的创新交流与合作,促进知识、技术的相互溢出,共同实现技术创新能力提质增效;当相邻国家高新区开放创新水平差距较大时,低水平国家高新区创新基础相对较差,对全球优质创新资源吸引力较弱,导致优质创新资源更倾向于流向相邻高水平开放创新水平的国家高新区,此时高水平国家高新区对周边低水平国家高新区虹吸效应大于溢出效应,由此创新差距拉大。
5 政策启示
根据研究结论得出以下启示。
一是增强区域内创新协同度。一方面,引导和支持区域内部不同国家高新区创新市场联动发展,共同规划和建设技术或知识商品流通的公共基础设施,共建科技成果转移转化市场定价机制,规范科技成果与知识产权交易,形成畅通无阻、联系紧密的技术市场交易网络,发挥区域内部不同国家高新区间知识和技术溢出效应;另一方面,关注区域内部不同国家高新区之间政策协调性问题,增强政策之间的互动性,避免政策的盲目竞争,尊重市场经济规律,更好发挥政府政策对创新创业活动的协调作用。
二是推动跨区域协调发展。一方面,支持相对落后的东北、长江中游、黄河中游、大西南、大西北等国家高新区对接相对领先的北部沿海、东部沿海、南部沿海等国家高新区的创新资源,编制跨区域产业技术合作项目目录,优先对联合申报项目给予资金支持;另一方面,加强两地管委会工作人员的沟通交流,鼓励和支持落后园区探索与先进园区及其所属产业园合作共建园中园或共管园(如南宁中关村科技园),实施“一园一策”利益分享机制,引进先进园区重点科研机构、科研院所、大型企业入驻临时办公,优先配套办公场所、中试车间及产业化用地。
三是实施差异化创新战略。一方面,就开放创新水平相对先进国家高新区(如北京中关村、上海张江国家高新区等)而言,发挥对落后园区的引领和带动作用,着力提升自主创新和原始创新能力,瞄准和钻研国际前沿知识和关键技术,突破国外技术封锁和垄断,破解一系列核心技术问题,努力将园区建成能代表中国甚至国际最高科技水平的样板区;另一方面,就开放创新水平相对落后国家高新区而言,聚焦自身已有的技术优势和发展特色,大力实施特色发展战略,持续加大技术研发投入,力争在自身特色优势领域中取得重大技术创新突破,做大做强自身特色优势领域,增强园区技术创新竞争力和影响力。
四是深化全球开放协同。一方面,支持头部高新区“走出去”,鼓励在创新资源富集的国家和地区布局建设海外研发中心和创新飞地,前瞻性嵌入全球创新链条,掌握创新主导权;另一方面,推动高新区“引进来”,通过举办国际性产业技术论坛、共建国际技术转移中心等方式,吸引国际科技组织、顶尖人才团队和跨国公司研发部门落地,提升对全球高端创新要素的集聚和整合能力。


